The Baltic tigers: from Soviet republics to Portugal’s level Lithuania, Estonia and Latvia were among the poorest parts of Europe in the 1990s. Lithuania has since passed Portugal, and even Japan, in GDP per person adjusted for prices.
November 17, 2026 · Numbers update automatically with the latest data
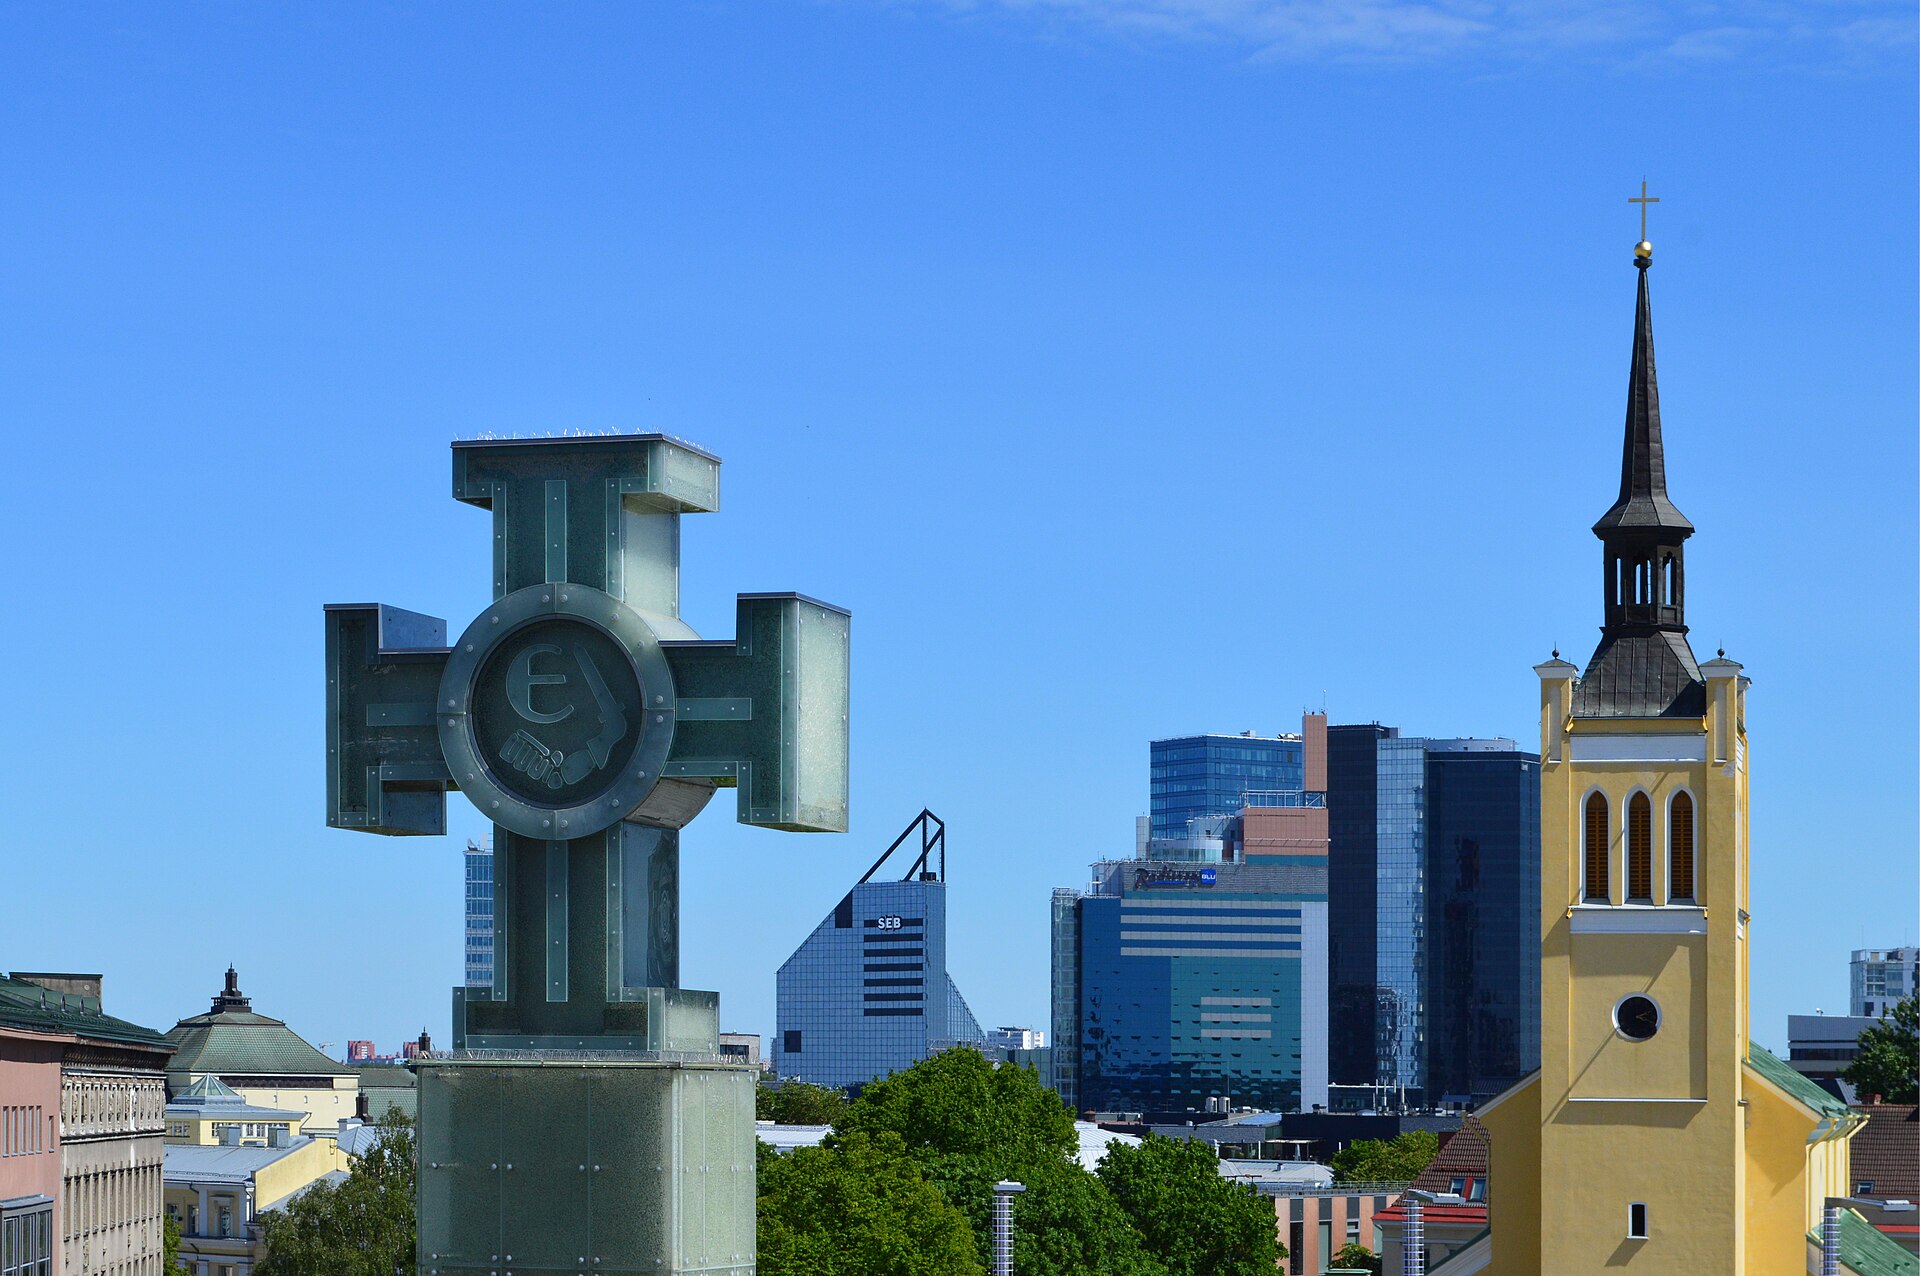
Photo: Scotch Mist · Wikimedia Commons · CC BY-SA 4.0 When Lithuania , Estonia and Latvia regained independence in 1991, they had Soviet-era factories, no currencies of their own and almost no trade ties with the West. Output fell hard. In 2000 Lithuania's GDP per person, adjusted for prices, was $8,473 . Portugal was at $18,883 .
$0 $20,000 $40,000 $60,000 $80,000 1995 1999 2003 2007 2011 2015 2019 2023 2025 Lithuania 1995: $6,023 Lithuania 1996: $6,479 Lithuania 1997: $7,167 Lithuania 1998: $7,847 Lithuania 1999: $7,919 Lithuania 2000: $8,473 Lithuania 2001: $9,399 Lithuania 2002: $10,296 Lithuania 2003: $11,661 Lithuania 2004: $12,605 Lithuania 2005: $13,949 Lithuania 2006: $15,522 Lithuania 2007: $17,970 Lithuania 2008: $19,412 Lithuania 2009: $17,054 Lithuania 2010: $18,721 Lithuania 2011: $21,558 Lithuania 2012: $23,276 Lithuania 2013: $24,892 Lithuania 2014: $26,277 Lithuania 2015: $26,950 Lithuania 2016: $28,702 Lithuania 2017: $31,301 Lithuania 2018: $36,495 Lithuania 2019: $40,565 Lithuania 2020: $41,268 Lithuania 2021: $45,903 Lithuania 2022: $50,647 Lithuania 2023: $52,712 Lithuania 2024: $55,705 Lithuania 2025: $56,834 Estonia 1995: $6,478 Estonia 1996: $6,890 Estonia 1997: $7,977 Estonia 1998: $8,452 Estonia 1999: $8,414 Estonia 2000: $9,424 Estonia 2001: $10,310 Estonia 2002: $11,669 Estonia 2003: $13,132 Estonia 2004: $14,533 Estonia 2005: $16,635 Estonia 2006: $19,341 Estonia 2007: $22,195 Estonia 2008: $22,805 Estonia 2009: $20,482 Estonia 2010: $21,622 Estonia 2011: $24,661 Estonia 2012: $26,237 Estonia 2013: $27,831 Estonia 2014: $29,393 Estonia 2015: $29,722 Estonia 2016: $31,943 Estonia 2017: $34,517 Estonia 2018: $37,120 Estonia 2019: $40,583 Estonia 2020: $40,657 Estonia 2021: $44,245 Estonia 2022: $48,024 Estonia 2023: $48,858 Estonia 2024: $50,408 Estonia 2025: $52,124 Latvia 1995: $5,391 Latvia 1996: $5,689 Latvia 1997: $6,365 Latvia 1998: $6,922 Latvia 1999: $7,258 Latvia 2000: $7,848 Latvia 2001: $8,808 Latvia 2002: $9,570 Latvia 2003: $10,193 Latvia 2004: $11,320 Latvia 2005: $12,825 Latvia 2006: $14,182 Latvia 2007: $16,248 Latvia 2008: $17,446 Latvia 2009: $15,542 Latvia 2010: $16,370 Latvia 2011: $17,678 Latvia 2012: $19,419 Latvia 2013: $20,470 Latvia 2014: $21,551 Latvia 2015: $22,538 Latvia 2016: $24,058 Latvia 2017: $25,767 Latvia 2018: $29,820 Latvia 2019: $32,196 Latvia 2020: $32,749 Latvia 2021: $36,921 Latvia 2022: $40,555 Latvia 2023: $42,777 Latvia 2024: $43,876 Latvia 2025: $46,131 Portugal 1995: $14,407 Portugal 1996: $14,922 Portugal 1997: $15,789 Portugal 1998: $16,688 Portugal 1999: $17,718 Portugal 2000: $18,883 Portugal 2001: $19,528 Portugal 2002: $20,356 Portugal 2003: $20,849 Portugal 2004: $21,475 Portugal 2005: $22,726 Portugal 2006: $24,678 Portugal 2007: $25,738 Portugal 2008: $26,666 Portugal 2009: $26,473 Portugal 2010: $27,292 Portugal 2011: $26,802 Portugal 2012: $26,476 Portugal 2013: $27,967 Portugal 2014: $28,765 Portugal 2015: $29,608 Portugal 2016: $31,591 Portugal 2017: $32,972 Portugal 2018: $34,896 Portugal 2019: $37,867 Portugal 2020: $35,967 Portugal 2021: $38,657 Portugal 2022: $45,251 Portugal 2023: $49,801 Portugal 2024: $52,511 Portugal 2025: $53,145 Finland 1995: $19,567 Finland 1996: $20,066 Finland 1997: $21,786 Finland 1998: $23,572 Finland 1999: $24,764 Finland 2000: $26,784 Finland 2001: $27,798 Finland 2002: $28,594 Finland 2003: $29,043 Finland 2004: $31,196 Finland 2005: $32,048 Finland 2006: $34,442 Finland 2007: $37,841 Finland 2008: $40,084 Finland 2009: $37,987 Finland 2010: $38,949 Finland 2011: $40,848 Finland 2012: $40,739 Finland 2013: $41,326 Finland 2014: $41,543 Finland 2015: $42,254 Finland 2016: $44,565 Finland 2017: $47,237 Finland 2018: $49,244 Finland 2019: $52,272 Finland 2020: $53,292 Finland 2021: $56,790 Finland 2022: $62,134 Finland 2023: $63,466 Finland 2024: $65,136 Finland 2025: $65,890 Finland Lithuania Portugal Estonia Latvia $0 $20,000 $40,000 $60,000 $80,000 1995 1999 2003 2007 2011 2015 2019 2025 Lithuania 1995: $6,023 Lithuania 1996: $6,479 Lithuania 1997: $7,167 Lithuania 1998: $7,847 Lithuania 1999: $7,919 Lithuania 2000: $8,473 Lithuania 2001: $9,399 Lithuania 2002: $10,296 Lithuania 2003: $11,661 Lithuania 2004: $12,605 Lithuania 2005: $13,949 Lithuania 2006: $15,522 Lithuania 2007: $17,970 Lithuania 2008: $19,412 Lithuania 2009: $17,054 Lithuania 2010: $18,721 Lithuania 2011: $21,558 Lithuania 2012: $23,276 Lithuania 2013: $24,892 Lithuania 2014: $26,277 Lithuania 2015: $26,950 Lithuania 2016: $28,702 Lithuania 2017: $31,301 Lithuania 2018: $36,495 Lithuania 2019: $40,565 Lithuania 2020: $41,268 Lithuania 2021: $45,903 Lithuania 2022: $50,647 Lithuania 2023: $52,712 Lithuania 2024: $55,705 Lithuania 2025: $56,834 Estonia 1995: $6,478 Estonia 1996: $6,890 Estonia 1997: $7,977 Estonia 1998: $8,452 Estonia 1999: $8,414 Estonia 2000: $9,424 Estonia 2001: $10,310 Estonia 2002: $11,669 Estonia 2003: $13,132 Estonia 2004: $14,533 Estonia 2005: $16,635 Estonia 2006: $19,341 Estonia 2007: $22,195 Estonia 2008: $22,805 Estonia 2009: $20,482 Estonia 2010: $21,622 Estonia 2011: $24,661 Estonia 2012: $26,237 Estonia 2013: $27,831 Estonia 2014: $29,393 Estonia 2015: $29,722 Estonia 2016: $31,943 Estonia 2017: $34,517 Estonia 2018: $37,120 Estonia 2019: $40,583 Estonia 2020: $40,657 Estonia 2021: $44,245 Estonia 2022: $48,024 Estonia 2023: $48,858 Estonia 2024: $50,408 Estonia 2025: $52,124 Latvia 1995: $5,391 Latvia 1996: $5,689 Latvia 1997: $6,365 Latvia 1998: $6,922 Latvia 1999: $7,258 Latvia 2000: $7,848 Latvia 2001: $8,808 Latvia 2002: $9,570 Latvia 2003: $10,193 Latvia 2004: $11,320 Latvia 2005: $12,825 Latvia 2006: $14,182 Latvia 2007: $16,248 Latvia 2008: $17,446 Latvia 2009: $15,542 Latvia 2010: $16,370 Latvia 2011: $17,678 Latvia 2012: $19,419 Latvia 2013: $20,470 Latvia 2014: $21,551 Latvia 2015: $22,538 Latvia 2016: $24,058 Latvia 2017: $25,767 Latvia 2018: $29,820 Latvia 2019: $32,196 Latvia 2020: $32,749 Latvia 2021: $36,921 Latvia 2022: $40,555 Latvia 2023: $42,777 Latvia 2024: $43,876 Latvia 2025: $46,131 Portugal 1995: $14,407 Portugal 1996: $14,922 Portugal 1997: $15,789 Portugal 1998: $16,688 Portugal 1999: $17,718 Portugal 2000: $18,883 Portugal 2001: $19,528 Portugal 2002: $20,356 Portugal 2003: $20,849 Portugal 2004: $21,475 Portugal 2005: $22,726 Portugal 2006: $24,678 Portugal 2007: $25,738 Portugal 2008: $26,666 Portugal 2009: $26,473 Portugal 2010: $27,292 Portugal 2011: $26,802 Portugal 2012: $26,476 Portugal 2013: $27,967 Portugal 2014: $28,765 Portugal 2015: $29,608 Portugal 2016: $31,591 Portugal 2017: $32,972 Portugal 2018: $34,896 Portugal 2019: $37,867 Portugal 2020: $35,967 Portugal 2021: $38,657 Portugal 2022: $45,251 Portugal 2023: $49,801 Portugal 2024: $52,511 Portugal 2025: $53,145 Finland 1995: $19,567 Finland 1996: $20,066 Finland 1997: $21,786 Finland 1998: $23,572 Finland 1999: $24,764 Finland 2000: $26,784 Finland 2001: $27,798 Finland 2002: $28,594 Finland 2003: $29,043 Finland 2004: $31,196 Finland 2005: $32,048 Finland 2006: $34,442 Finland 2007: $37,841 Finland 2008: $40,084 Finland 2009: $37,987 Finland 2010: $38,949 Finland 2011: $40,848 Finland 2012: $40,739 Finland 2013: $41,326 Finland 2014: $41,543 Finland 2015: $42,254 Finland 2016: $44,565 Finland 2017: $47,237 Finland 2018: $49,244 Finland 2019: $52,272 Finland 2020: $53,292 Finland 2021: $56,790 Finland 2022: $62,134 Finland 2023: $63,466 Finland 2024: $65,136 Finland 2025: $65,890 Finland Lithuania Portugal Estonia Latvia GDP per person (PPP) · 1995–2025 · Open in the interactive tool → Small, open, fast
All three bet on openness: flat taxes, quick privatisation, joining the EU and NATO in 2004 and later the euro. Estonia went fully digital early on. Its e-government and start-up scene became world-famous.
It was not a smooth ride. In 2009 the Baltics had some of the deepest recessions in the world, with output falling by 14–15% in a year. They recovered with painful wage cuts rather than devaluation.
Where they stand now
In 2025 Lithuania reached $56,834 per person, ahead of Portugal ($53,145 ) and roughly level with Japan ($55,422 ). Estonia is at $52,124 , Latvia at $46,131 .
The next target is Finland across the Gulf, at $65,890 . That gap has been shrinking for thirty years.
Source: World Bank, World Development Indicators (CC BY 4.0). Latest year: 2025.