Croatia's quiet climb past Hungary

Croatia lost a decade to war and then to a long recession after 2008. Since 2015 it has grown fast, and adjusted for prices it is now level with or ahead of Hungary.

November 17, 2026 · Numbers update automatically with the latest data

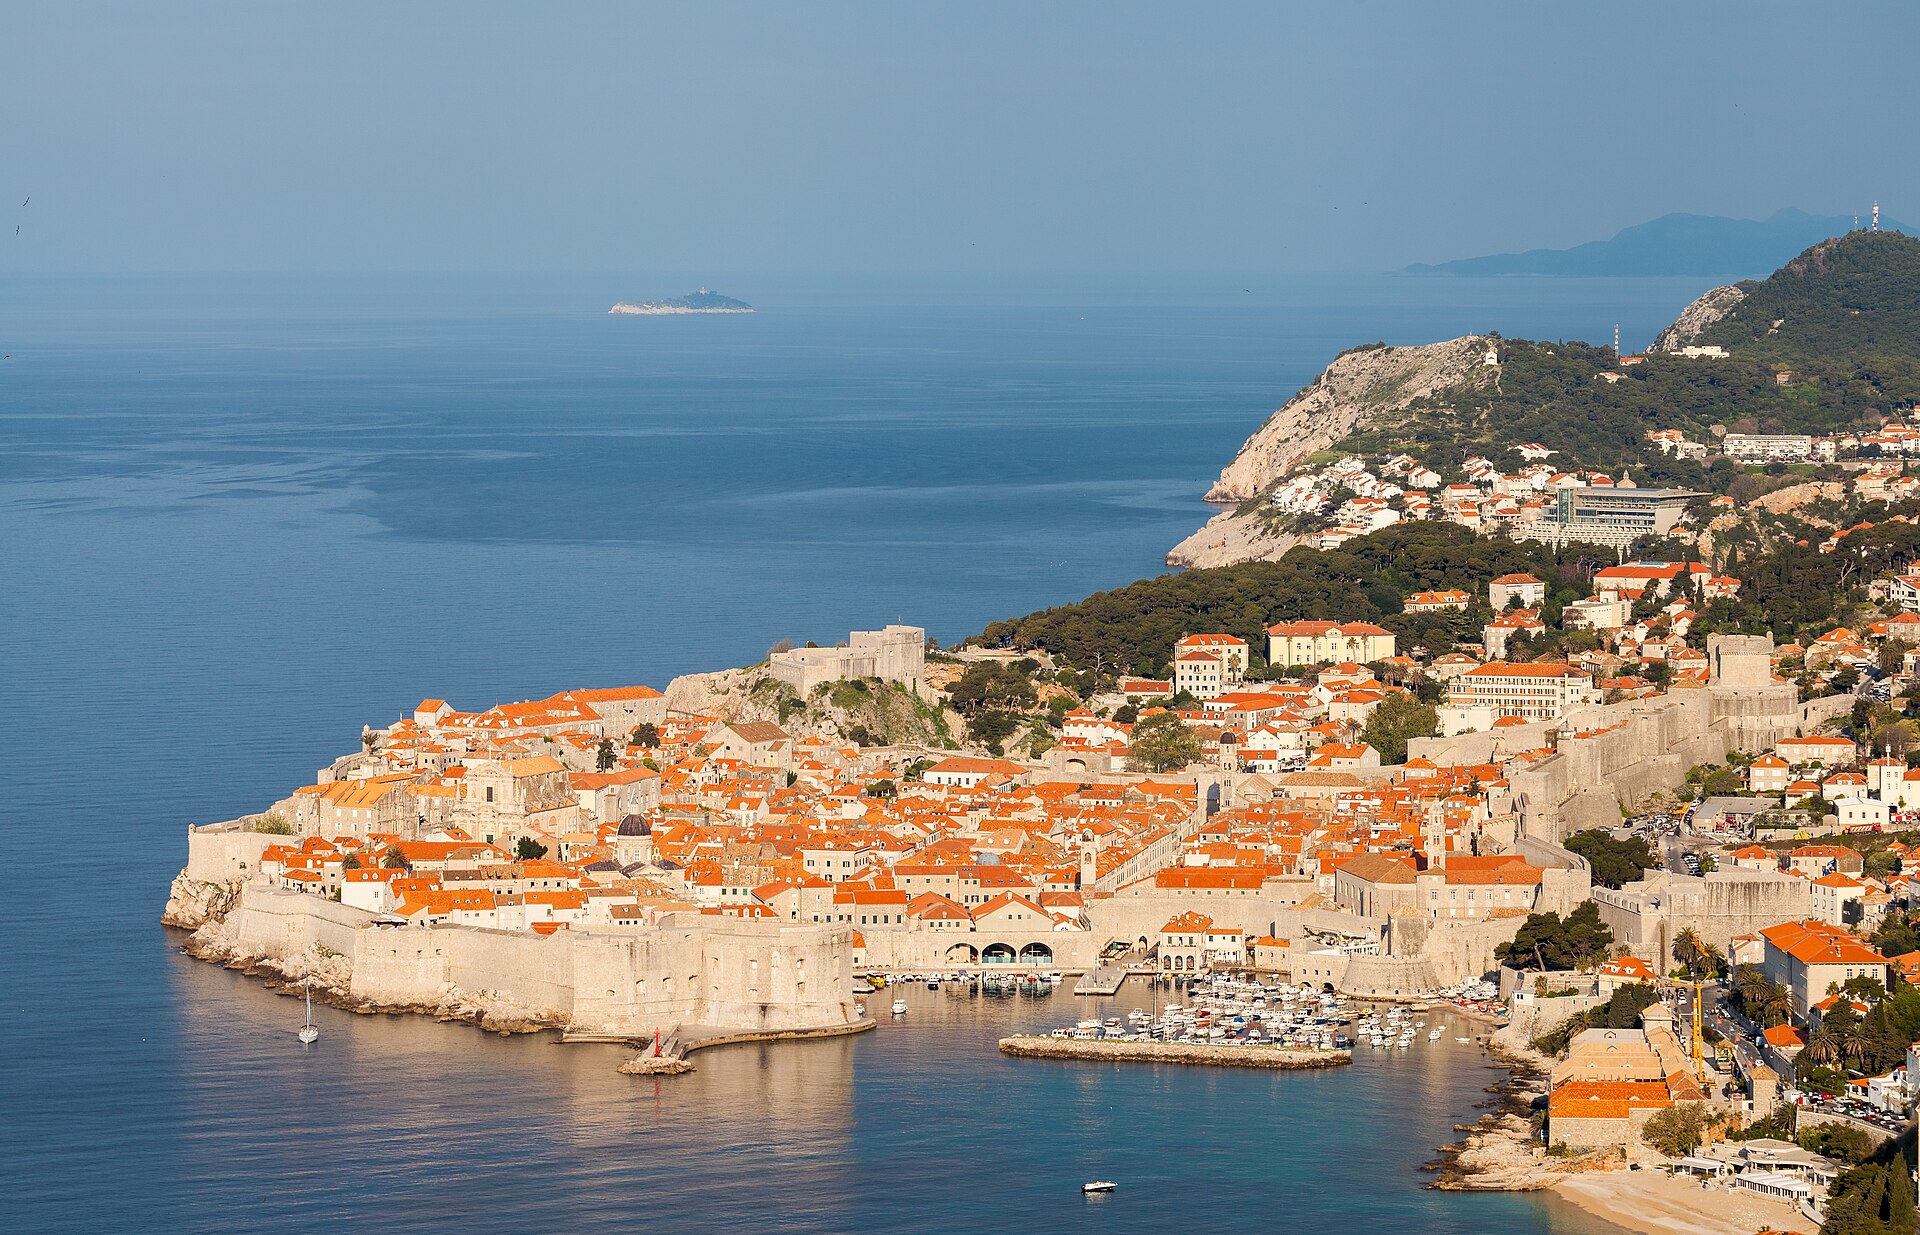
Casco viejo de Dubrovnik, Croacia, 2014-04-14, DD 07
Photo: Diego Delso · Wikimedia Commons · CC BY-SA 3.0

Croatia had a hard start. The war of the early 1990s destroyed much of its economy, and after the 2008 crisis it went through six straight years of recession, one of the longest in Europe.

$0$10,000$20,000$30,000$40,000$50,000$60,000$70,0002000200420082012201620202025Croatia 2000: $10,675Croatia 2001: $11,652Croatia 2002: $12,775Croatia 2003: $13,693Croatia 2004: $14,685Croatia 2005: $15,451Croatia 2006: $17,629Croatia 2007: $19,568Croatia 2008: $21,017Croatia 2009: $20,359Croatia 2010: $20,141Croatia 2011: $21,189Croatia 2012: $21,620Croatia 2013: $22,430Croatia 2014: $22,704Croatia 2015: $23,748Croatia 2016: $25,802Croatia 2017: $27,890Croatia 2018: $29,788Croatia 2019: $33,067Croatia 2020: $31,596Croatia 2021: $36,930Croatia 2022: $42,121Croatia 2023: $47,756Croatia 2024: $49,553Croatia 2025: $50,949Hungary 2000: $11,872Hungary 2001: $13,222Hungary 2002: $14,532Hungary 2003: $15,459Hungary 2004: $16,251Hungary 2005: $17,091Hungary 2006: $18,363Hungary 2007: $19,089Hungary 2008: $20,709Hungary 2009: $20,691Hungary 2010: $21,691Hungary 2011: $22,992Hungary 2012: $23,206Hungary 2013: $24,591Hungary 2014: $25,796Hungary 2015: $26,937Hungary 2016: $28,178Hungary 2017: $29,727Hungary 2018: $32,258Hungary 2019: $35,627Hungary 2020: $35,585Hungary 2021: $38,887Hungary 2022: $44,233Hungary 2023: $46,377Hungary 2024: $48,540Hungary 2025: $49,839Slovenia 2000: $17,891Slovenia 2001: $18,764Slovenia 2002: $19,999Slovenia 2003: $20,913Slovenia 2004: $22,588Slovenia 2005: $23,688Slovenia 2006: $25,570Slovenia 2007: $27,470Slovenia 2008: $29,466Slovenia 2009: $27,224Slovenia 2010: $27,574Slovenia 2011: $28,714Slovenia 2012: $28,789Slovenia 2013: $29,633Slovenia 2014: $30,572Slovenia 2015: $31,329Slovenia 2016: $33,576Slovenia 2017: $36,187Slovenia 2018: $38,618Slovenia 2019: $42,381Slovenia 2020: $41,775Slovenia 2021: $45,925Slovenia 2022: $52,324Slovenia 2023: $56,163Slovenia 2024: $57,582Slovenia 2025: $59,244Serbia 2000: $6,416Serbia 2001: $6,803Serbia 2002: $7,563Serbia 2003: $8,022Serbia 2004: $8,715Serbia 2005: $9,397Serbia 2006: $10,463Serbia 2007: $11,685Serbia 2008: $13,123Serbia 2009: $13,038Serbia 2010: $13,321Serbia 2011: $14,297Serbia 2012: $14,507Serbia 2013: $15,246Serbia 2014: $15,296Serbia 2015: $15,547Serbia 2016: $16,456Serbia 2017: $17,285Serbia 2018: $18,468Serbia 2019: $20,588Serbia 2020: $21,013Serbia 2021: $23,407Serbia 2022: $26,145Serbia 2023: $29,778Serbia 2024: $32,835Serbia 2025: $33,911SloveniaCroatiaHungarySerbia
$0$10,000$20,000$30,000$40,000$50,000$60,000$70,0002000200820162025Croatia 2000: $10,675Croatia 2001: $11,652Croatia 2002: $12,775Croatia 2003: $13,693Croatia 2004: $14,685Croatia 2005: $15,451Croatia 2006: $17,629Croatia 2007: $19,568Croatia 2008: $21,017Croatia 2009: $20,359Croatia 2010: $20,141Croatia 2011: $21,189Croatia 2012: $21,620Croatia 2013: $22,430Croatia 2014: $22,704Croatia 2015: $23,748Croatia 2016: $25,802Croatia 2017: $27,890Croatia 2018: $29,788Croatia 2019: $33,067Croatia 2020: $31,596Croatia 2021: $36,930Croatia 2022: $42,121Croatia 2023: $47,756Croatia 2024: $49,553Croatia 2025: $50,949Hungary 2000: $11,872Hungary 2001: $13,222Hungary 2002: $14,532Hungary 2003: $15,459Hungary 2004: $16,251Hungary 2005: $17,091Hungary 2006: $18,363Hungary 2007: $19,089Hungary 2008: $20,709Hungary 2009: $20,691Hungary 2010: $21,691Hungary 2011: $22,992Hungary 2012: $23,206Hungary 2013: $24,591Hungary 2014: $25,796Hungary 2015: $26,937Hungary 2016: $28,178Hungary 2017: $29,727Hungary 2018: $32,258Hungary 2019: $35,627Hungary 2020: $35,585Hungary 2021: $38,887Hungary 2022: $44,233Hungary 2023: $46,377Hungary 2024: $48,540Hungary 2025: $49,839Slovenia 2000: $17,891Slovenia 2001: $18,764Slovenia 2002: $19,999Slovenia 2003: $20,913Slovenia 2004: $22,588Slovenia 2005: $23,688Slovenia 2006: $25,570Slovenia 2007: $27,470Slovenia 2008: $29,466Slovenia 2009: $27,224Slovenia 2010: $27,574Slovenia 2011: $28,714Slovenia 2012: $28,789Slovenia 2013: $29,633Slovenia 2014: $30,572Slovenia 2015: $31,329Slovenia 2016: $33,576Slovenia 2017: $36,187Slovenia 2018: $38,618Slovenia 2019: $42,381Slovenia 2020: $41,775Slovenia 2021: $45,925Slovenia 2022: $52,324Slovenia 2023: $56,163Slovenia 2024: $57,582Slovenia 2025: $59,244Serbia 2000: $6,416Serbia 2001: $6,803Serbia 2002: $7,563Serbia 2003: $8,022Serbia 2004: $8,715Serbia 2005: $9,397Serbia 2006: $10,463Serbia 2007: $11,685Serbia 2008: $13,123Serbia 2009: $13,038Serbia 2010: $13,321Serbia 2011: $14,297Serbia 2012: $14,507Serbia 2013: $15,246Serbia 2014: $15,296Serbia 2015: $15,547Serbia 2016: $16,456Serbia 2017: $17,285Serbia 2018: $18,468Serbia 2019: $20,588Serbia 2020: $21,013Serbia 2021: $23,407Serbia 2022: $26,145Serbia 2023: $29,778Serbia 2024: $32,835Serbia 2025: $33,911SloveniaCroatiaHungarySerbia
GDP per person (PPP) · 2000–2025 · Open in the interactive tool →

The turn

Since joining the EU in 2013, and especially after 2015, growth picked up. Tourism, EU funds and a building boom helped. In 2023 Croatia adopted the euro and joined the Schengen area.

Adjusted for local prices, Croatia now has a GDP per person of $50,949, against $49,839 in Hungary. In 2000 Croatia was at 90% of the Hungarian level.

Still behind Slovenia

Its northern neighbour Slovenia remains the richest country of the former Yugoslavia, at $59,244.

Source: World Bank, World Development Indicators (CC BY 4.0). Latest year: 2025.
More stories

🇸🇮 Slovenia: $59,244$59,244🇭🇷 Croatia: $50,949$50,949🇲🇪 Montenegro: $35,430$35,430🇷🇸 Serbia: $33,911$33,911🇲🇰 North Macedonia: $28,027$28,027🇧🇦 Bosnia & Herzegovina: $25,815$25,815🇽🇰 Kosovo: $19,262$19,262
One country, seven economies: former Yugoslavia todayYugoslavia broke apart in the 1990s. Its successor states have grown at very different speeds. Slovenia is now about three times richer than Kosovo.
$0$10,000$20,000$30,000$40,000$50,000$60,00019901995200020052010201520202025Moldova 1990: $6,894Moldova 1991: $5,979Moldova 1992: $4,337Moldova 1993: $4,394Moldova 1994: $3,111Moldova 1995: $3,146Moldova 1996: $3,022Moldova 1997: $3,136Moldova 1998: $2,965Moldova 1999: $2,910Moldova 2000: $3,044Moldova 2001: $3,311Moldova 2002: $3,633Moldova 2003: $3,960Moldova 2004: $4,378Moldova 2005: $4,866Moldova 2006: $5,271Moldova 2007: $5,590Moldova 2008: $6,153Moldova 2009: $5,828Moldova 2010: $6,324Moldova 2011: $6,832Moldova 2012: $7,256Moldova 2013: $8,231Moldova 2014: $8,642Moldova 2015: $9,197Moldova 2016: $10,326Moldova 2017: $11,253Moldova 2018: $11,869Moldova 2019: $13,414Moldova 2020: $13,528Moldova 2021: $15,681Moldova 2022: $16,440Moldova 2023: $17,749Moldova 2024: $18,664Moldova 2025: $19,992Romania 1990: $5,280Romania 1991: $4,795Romania 1992: $4,515Romania 1993: $4,699Romania 1994: $4,995Romania 1995: $5,429Romania 1996: $5,746Romania 1997: $5,564Romania 1998: $5,545Romania 1999: $5,596Romania 2000: $5,850Romania 2001: $6,520Romania 2002: $7,162Romania 2003: $7,560Romania 2004: $8,989Romania 2005: $9,602Romania 2006: $11,554Romania 2007: $13,703Romania 2008: $16,782Romania 2009: $16,641Romania 2010: $17,355Romania 2011: $18,803Romania 2012: $19,808Romania 2013: $19,678Romania 2014: $20,633Romania 2015: $21,624Romania 2016: $23,906Romania 2017: $26,943Romania 2018: $29,383Romania 2019: $33,425Romania 2020: $34,194Romania 2021: $37,534Romania 2022: $41,978Romania 2023: $45,982Romania 2024: $49,076Romania 2025: $50,896Ukraine 1990: $7,591Ukraine 1991: $7,148Ukraine 1992: $6,568Ukraine 1993: $5,766Ukraine 1994: $4,565Ukraine 1995: $4,124Ukraine 1996: $3,812Ukraine 1997: $3,794Ukraine 1998: $3,794Ukraine 1999: $3,871Ukraine 2000: $4,228Ukraine 2001: $4,747Ukraine 2002: $5,123Ukraine 2003: $5,764Ukraine 2004: $6,663Ukraine 2005: $7,142Ukraine 2006: $7,971Ukraine 2007: $8,900Ukraine 2008: $9,324Ukraine 2009: $7,995Ukraine 2010: $8,453Ukraine 2011: $9,127Ukraine 2012: $9,552Ukraine 2013: $10,904Ukraine 2014: $9,975Ukraine 2015: $9,419Ukraine 2016: $10,301Ukraine 2017: $10,928Ukraine 2018: $11,883Ukraine 2019: $13,444Ukraine 2020: $14,685Ukraine 2021: $16,851Ukraine 2022: $13,877Ukraine 2023: $16,521Ukraine 2024: $17,423Ukraine 2025: $17,713
$0$10,000$20,000$30,000$40,000$50,000$60,0001990200020102025Moldova 1990: $6,894Moldova 1991: $5,979Moldova 1992: $4,337Moldova 1993: $4,394Moldova 1994: $3,111Moldova 1995: $3,146Moldova 1996: $3,022Moldova 1997: $3,136Moldova 1998: $2,965Moldova 1999: $2,910Moldova 2000: $3,044Moldova 2001: $3,311Moldova 2002: $3,633Moldova 2003: $3,960Moldova 2004: $4,378Moldova 2005: $4,866Moldova 2006: $5,271Moldova 2007: $5,590Moldova 2008: $6,153Moldova 2009: $5,828Moldova 2010: $6,324Moldova 2011: $6,832Moldova 2012: $7,256Moldova 2013: $8,231Moldova 2014: $8,642Moldova 2015: $9,197Moldova 2016: $10,326Moldova 2017: $11,253Moldova 2018: $11,869Moldova 2019: $13,414Moldova 2020: $13,528Moldova 2021: $15,681Moldova 2022: $16,440Moldova 2023: $17,749Moldova 2024: $18,664Moldova 2025: $19,992Romania 1990: $5,280Romania 1991: $4,795Romania 1992: $4,515Romania 1993: $4,699Romania 1994: $4,995Romania 1995: $5,429Romania 1996: $5,746Romania 1997: $5,564Romania 1998: $5,545Romania 1999: $5,596Romania 2000: $5,850Romania 2001: $6,520Romania 2002: $7,162Romania 2003: $7,560Romania 2004: $8,989Romania 2005: $9,602Romania 2006: $11,554Romania 2007: $13,703Romania 2008: $16,782Romania 2009: $16,641Romania 2010: $17,355Romania 2011: $18,803Romania 2012: $19,808Romania 2013: $19,678Romania 2014: $20,633Romania 2015: $21,624Romania 2016: $23,906Romania 2017: $26,943Romania 2018: $29,383Romania 2019: $33,425Romania 2020: $34,194Romania 2021: $37,534Romania 2022: $41,978Romania 2023: $45,982Romania 2024: $49,076Romania 2025: $50,896Ukraine 1990: $7,591Ukraine 1991: $7,148Ukraine 1992: $6,568Ukraine 1993: $5,766Ukraine 1994: $4,565Ukraine 1995: $4,124Ukraine 1996: $3,812Ukraine 1997: $3,794Ukraine 1998: $3,794Ukraine 1999: $3,871Ukraine 2000: $4,228Ukraine 2001: $4,747Ukraine 2002: $5,123Ukraine 2003: $5,764Ukraine 2004: $6,663Ukraine 2005: $7,142Ukraine 2006: $7,971Ukraine 2007: $8,900Ukraine 2008: $9,324Ukraine 2009: $7,995Ukraine 2010: $8,453Ukraine 2011: $9,127Ukraine 2012: $9,552Ukraine 2013: $10,904Ukraine 2014: $9,975Ukraine 2015: $9,419Ukraine 2016: $10,301Ukraine 2017: $10,928Ukraine 2018: $11,883Ukraine 2019: $13,444Ukraine 2020: $14,685Ukraine 2021: $16,851Ukraine 2022: $13,877Ukraine 2023: $16,521Ukraine 2024: $17,423Ukraine 2025: $17,713
Moldova and Romania: same language, very different pathsIn 1990 Moldova was richer per person than Romania. Today Romania is about two and a half times richer. What happened?
$0$10,000$20,000$30,000$40,000$50,000$60,00019901995200020052010201520202025Poland 1990: $6,185Poland 1991: $5,925Poland 1992: $6,193Poland 1993: $6,560Poland 1994: $7,040Poland 1995: $7,715Poland 1996: $8,310Poland 1997: $8,967Poland 1998: $9,521Poland 1999: $10,081Poland 2000: $10,721Poland 2001: $11,175Poland 2002: $11,841Poland 2003: $12,329Poland 2004: $13,413Poland 2005: $13,936Poland 2006: $15,205Poland 2007: $16,833Poland 2008: $18,372Poland 2009: $19,300Poland 2010: $20,991Poland 2011: $22,809Poland 2012: $23,728Poland 2013: $24,434Poland 2014: $25,460Poland 2015: $26,988Poland 2016: $28,360Poland 2017: $30,170Poland 2018: $32,345Poland 2019: $35,883Poland 2020: $37,089Poland 2021: $41,059Poland 2022: $46,777Poland 2023: $48,474Poland 2024: $51,263Poland 2025: $54,262Belarus 1990: $5,221Belarus 1991: $5,330Belarus 1992: $4,917Belarus 1993: $4,641Belarus 1994: $4,190Belarus 1995: $3,846Belarus 1996: $4,039Belarus 1997: $4,597Belarus 1998: $5,061Belarus 1999: $5,331Belarus 2000: $5,795Belarus 2001: $6,238Belarus 2002: $6,697Belarus 2003: $7,362Belarus 2004: $8,483Belarus 2005: $9,637Belarus 2006: $10,994Belarus 2007: $12,320Belarus 2008: $13,886Belarus 2009: $14,034Belarus 2010: $15,339Belarus 2011: $16,563Belarus 2012: $18,114Belarus 2013: $19,015Belarus 2014: $19,037Belarus 2015: $18,134Belarus 2016: $17,833Belarus 2017: $18,414Belarus 2018: $20,026Belarus 2019: $22,301Belarus 2020: $24,872Belarus 2021: $27,610Belarus 2022: $28,425Belarus 2023: $30,861Belarus 2024: $33,165Belarus 2025: $34,716Lithuania 1990: $9,029Lithuania 1991: $8,791Lithuania 1992: $7,087Lithuania 1993: $6,106Lithuania 1994: $5,667Lithuania 1995: $6,023Lithuania 1996: $6,479Lithuania 1997: $7,167Lithuania 1998: $7,847Lithuania 1999: $7,919Lithuania 2000: $8,473Lithuania 2001: $9,399Lithuania 2002: $10,296Lithuania 2003: $11,661Lithuania 2004: $12,605Lithuania 2005: $13,949Lithuania 2006: $15,522Lithuania 2007: $17,970Lithuania 2008: $19,412Lithuania 2009: $17,054Lithuania 2010: $18,721Lithuania 2011: $21,558Lithuania 2012: $23,276Lithuania 2013: $24,892Lithuania 2014: $26,277Lithuania 2015: $26,950Lithuania 2016: $28,702Lithuania 2017: $31,301Lithuania 2018: $36,495Lithuania 2019: $40,565Lithuania 2020: $41,268Lithuania 2021: $45,903Lithuania 2022: $50,647Lithuania 2023: $52,712Lithuania 2024: $55,705Lithuania 2025: $56,834
$0$10,000$20,000$30,000$40,000$50,000$60,0001990200020102025Poland 1990: $6,185Poland 1991: $5,925Poland 1992: $6,193Poland 1993: $6,560Poland 1994: $7,040Poland 1995: $7,715Poland 1996: $8,310Poland 1997: $8,967Poland 1998: $9,521Poland 1999: $10,081Poland 2000: $10,721Poland 2001: $11,175Poland 2002: $11,841Poland 2003: $12,329Poland 2004: $13,413Poland 2005: $13,936Poland 2006: $15,205Poland 2007: $16,833Poland 2008: $18,372Poland 2009: $19,300Poland 2010: $20,991Poland 2011: $22,809Poland 2012: $23,728Poland 2013: $24,434Poland 2014: $25,460Poland 2015: $26,988Poland 2016: $28,360Poland 2017: $30,170Poland 2018: $32,345Poland 2019: $35,883Poland 2020: $37,089Poland 2021: $41,059Poland 2022: $46,777Poland 2023: $48,474Poland 2024: $51,263Poland 2025: $54,262Belarus 1990: $5,221Belarus 1991: $5,330Belarus 1992: $4,917Belarus 1993: $4,641Belarus 1994: $4,190Belarus 1995: $3,846Belarus 1996: $4,039Belarus 1997: $4,597Belarus 1998: $5,061Belarus 1999: $5,331Belarus 2000: $5,795Belarus 2001: $6,238Belarus 2002: $6,697Belarus 2003: $7,362Belarus 2004: $8,483Belarus 2005: $9,637Belarus 2006: $10,994Belarus 2007: $12,320Belarus 2008: $13,886Belarus 2009: $14,034Belarus 2010: $15,339Belarus 2011: $16,563Belarus 2012: $18,114Belarus 2013: $19,015Belarus 2014: $19,037Belarus 2015: $18,134Belarus 2016: $17,833Belarus 2017: $18,414Belarus 2018: $20,026Belarus 2019: $22,301Belarus 2020: $24,872Belarus 2021: $27,610Belarus 2022: $28,425Belarus 2023: $30,861Belarus 2024: $33,165Belarus 2025: $34,716Lithuania 1990: $9,029Lithuania 1991: $8,791Lithuania 1992: $7,087Lithuania 1993: $6,106Lithuania 1994: $5,667Lithuania 1995: $6,023Lithuania 1996: $6,479Lithuania 1997: $7,167Lithuania 1998: $7,847Lithuania 1999: $7,919Lithuania 2000: $8,473Lithuania 2001: $9,399Lithuania 2002: $10,296Lithuania 2003: $11,661Lithuania 2004: $12,605Lithuania 2005: $13,949Lithuania 2006: $15,522Lithuania 2007: $17,970Lithuania 2008: $19,412Lithuania 2009: $17,054Lithuania 2010: $18,721Lithuania 2011: $21,558Lithuania 2012: $23,276Lithuania 2013: $24,892Lithuania 2014: $26,277Lithuania 2015: $26,950Lithuania 2016: $28,702Lithuania 2017: $31,301Lithuania 2018: $36,495Lithuania 2019: $40,565Lithuania 2020: $41,268Lithuania 2021: $45,903Lithuania 2022: $50,647Lithuania 2023: $52,712Lithuania 2024: $55,705Lithuania 2025: $56,834
Belarus and its neighbours: a natural experimentBelarus, Poland and Lithuania started the 1990s at similar income levels. Their choices since then have produced very different results.
💬 Suggest an improvement

NationVS is a free, ad-free project and we build it with your ideas. What is missing, confusing or would make it more useful?

Anonymous: we store only your text, the page and the language. Please do not include personal data.