GDP per person is not your salary

Ireland's GDP per person is far above Germany's, yet Irish households do not spend twice as much. Here is what GDP per person does and does not measure.

November 17, 2026 · Numbers update automatically with the latest data
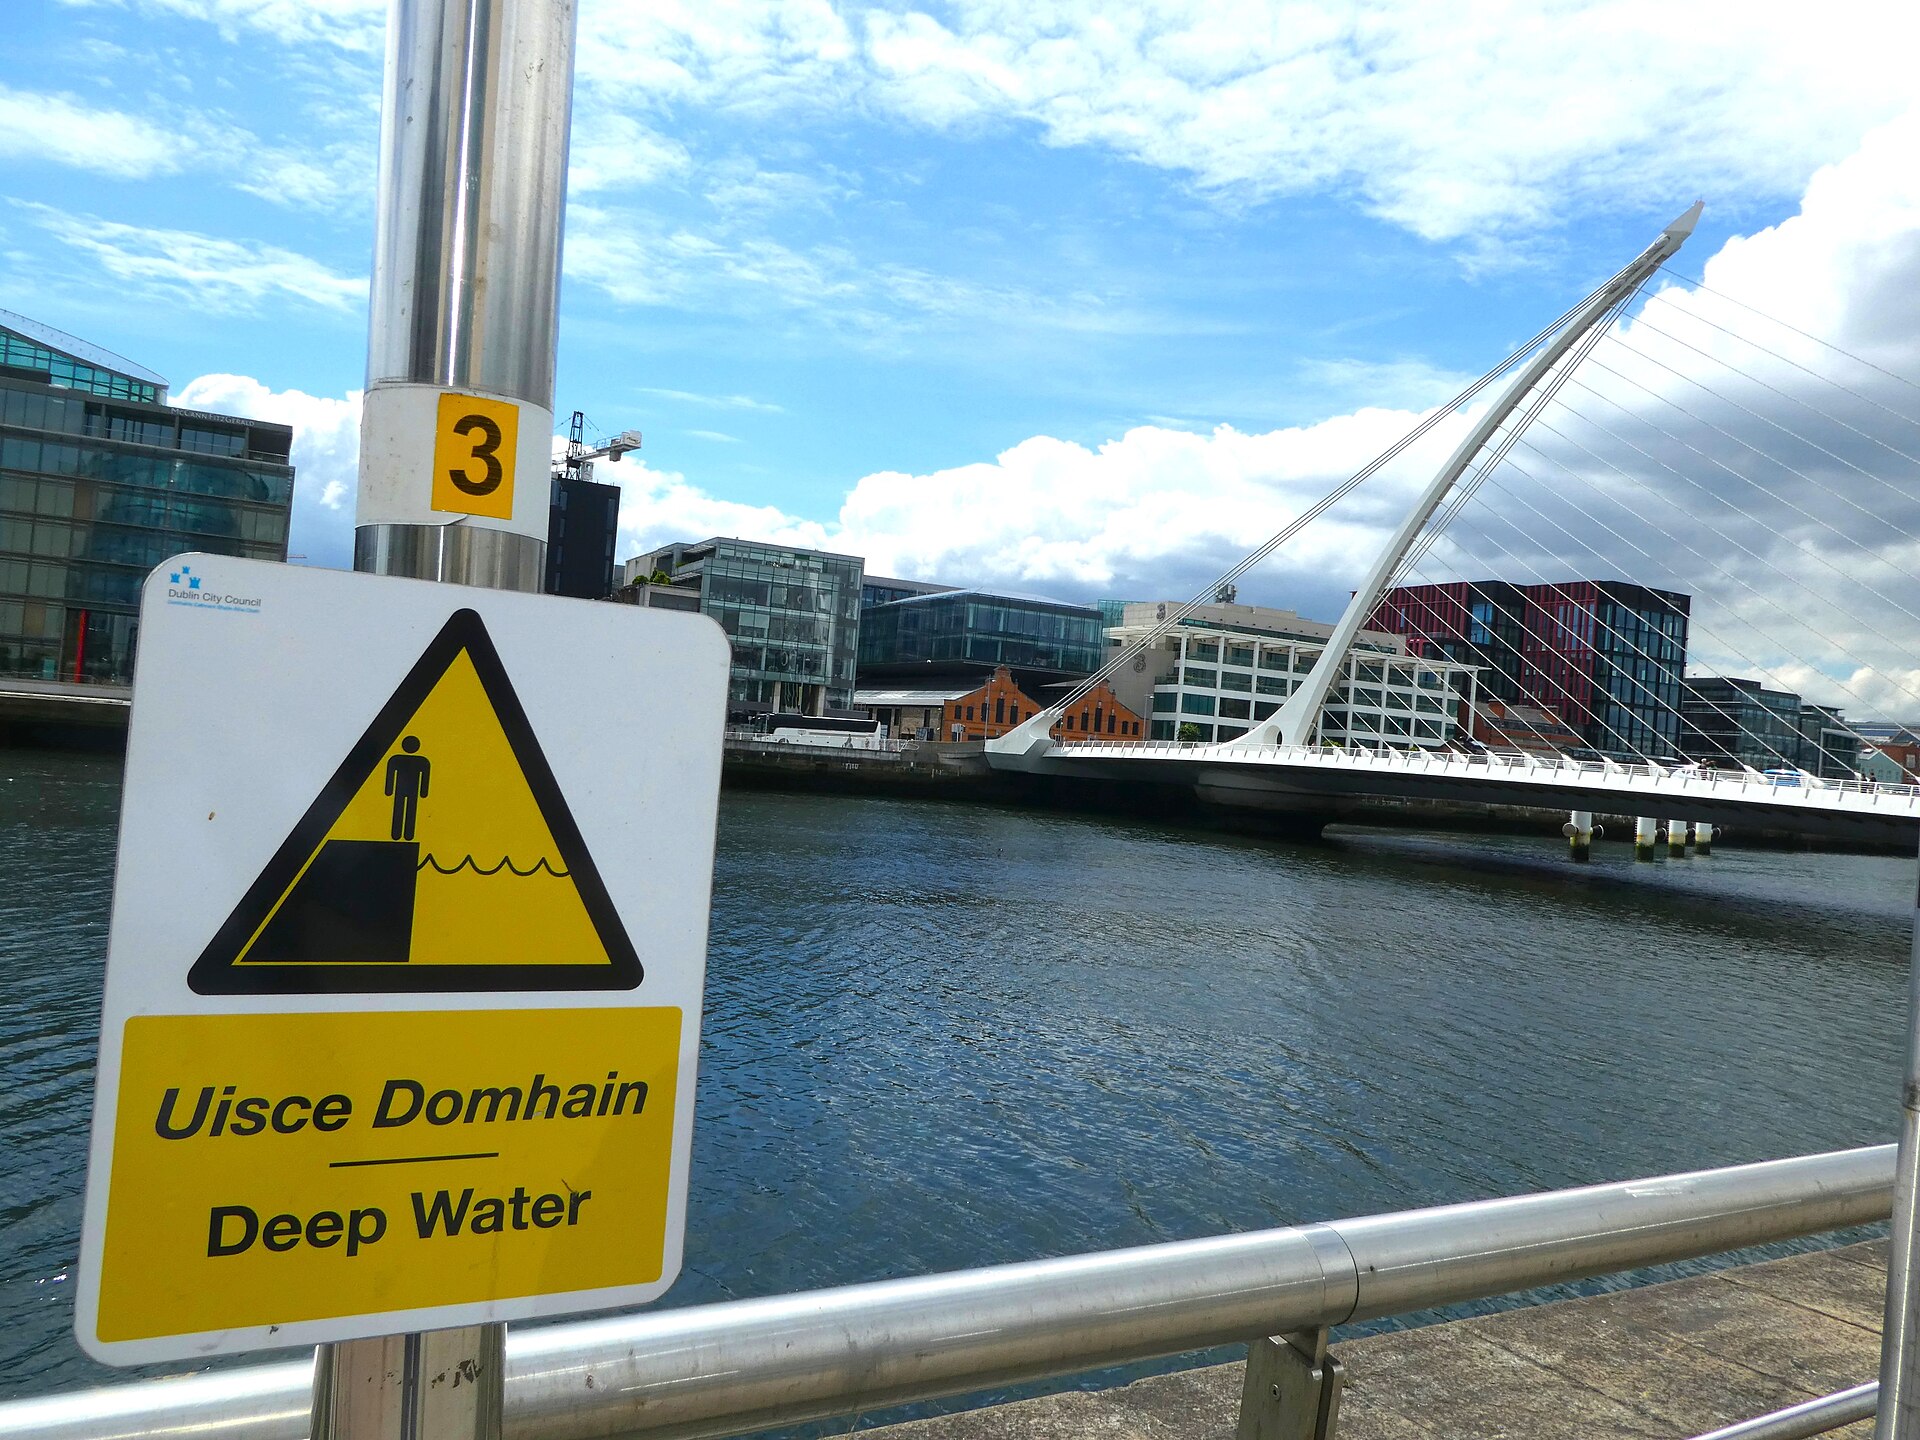
Sign-1180532, Docklands, Dublin, Ireland
Photo: Leimanbhradain · Wikimedia Commons · CC BY 4.0

GDP is the value of everything produced in a country in a year. Divide it by the population and you get GDP per person, the most common yardstick of how rich a country is. It is useful, but it is not the same as what people earn.

🇱🇺 Luxembourg🇱🇺 Luxembourg: $147,246$147,246🇮🇪 Ireland🇮🇪 Ireland: $131,601$131,601🇺🇸 United States🇺🇸 United States: $90,026$90,026🇩🇪 Germany🇩🇪 Germany: $60,497$60,497🇵🇱 Poland🇵🇱 Poland: $28,419$28,419🇭🇺 Hungary🇭🇺 Hungary: $25,908$25,908
GDP per person (Nominal) · 2025 · Open in the interactive tool →

What sits in the gap

GDP includes company profits, including those of foreign-owned firms that send them abroad. It includes depreciation, taxes and money the government spends on roads and schools. Children and pensioners are counted in the population even though they do not earn wages.

A better everyday measure

Household spending per person is closer to everyday living standards. In Ireland GDP per person is $131,601 but household spending per person is $33,183. In the United States the figures are $90,026 and $58,212, and in Hungary $25,908 and $13,615.

Source: World Bank, World Development Indicators (CC BY 4.0). Latest year: 2025.

More stories

$0$20,000$40,000$60,000$80,000$100,00019901995200020052010201520202025
$0$20,000$40,000$60,000$80,000$100,0001990200020102025
The rule of 70: why small growth rates make huge differencesDivide 70 by a growth rate and you get the number of years it takes to double. A simple trick that explains why some countries pulled ahead so fast.
🇺🇸 United States: $30.77T$30.77T🇨🇳 China: $19.5T$19.5T🇩🇪 Germany: $5.05T$5.05T🇯🇵 Japan: $4.44T$4.44T🇬🇧 United Kingdom: $4T$4T🇮🇳 India: $3.96T$3.96T🇫🇷 France: $3.37T$3.37T🇮🇹 Italy: $2.55T$2.55T
The world's biggest economies: 2000 versus todayIn 2000 Japan was the second-largest economy in the world and China was barely larger than Italy. A quarter of a century later the ranking looks very different.
$0$50,000$100,000$150,000$200,0002000200420082012201620202025
$0$50,000$100,000$150,000$200,0002000200820162025
The fastest growers of the 21st centuryWhich countries have grown fastest since 2000? Oil discoveries, catch-up and reforms all feature in the list.
💬 Suggest an improvement

NationVS is a free, ad-free project and we build it with your ideas. What is missing, confusing or would make it more useful?

Anonymous: we store only your text, the page and the language. Please do not include personal data.