Portugal: from bailout to quiet recovery

In 2011 Portugal needed a bailout from the EU and the IMF. Since then it has cut its debt and grown steadily, while Eastern Europe has caught up with it.

November 17, 2026 · Numbers update automatically with the latest data
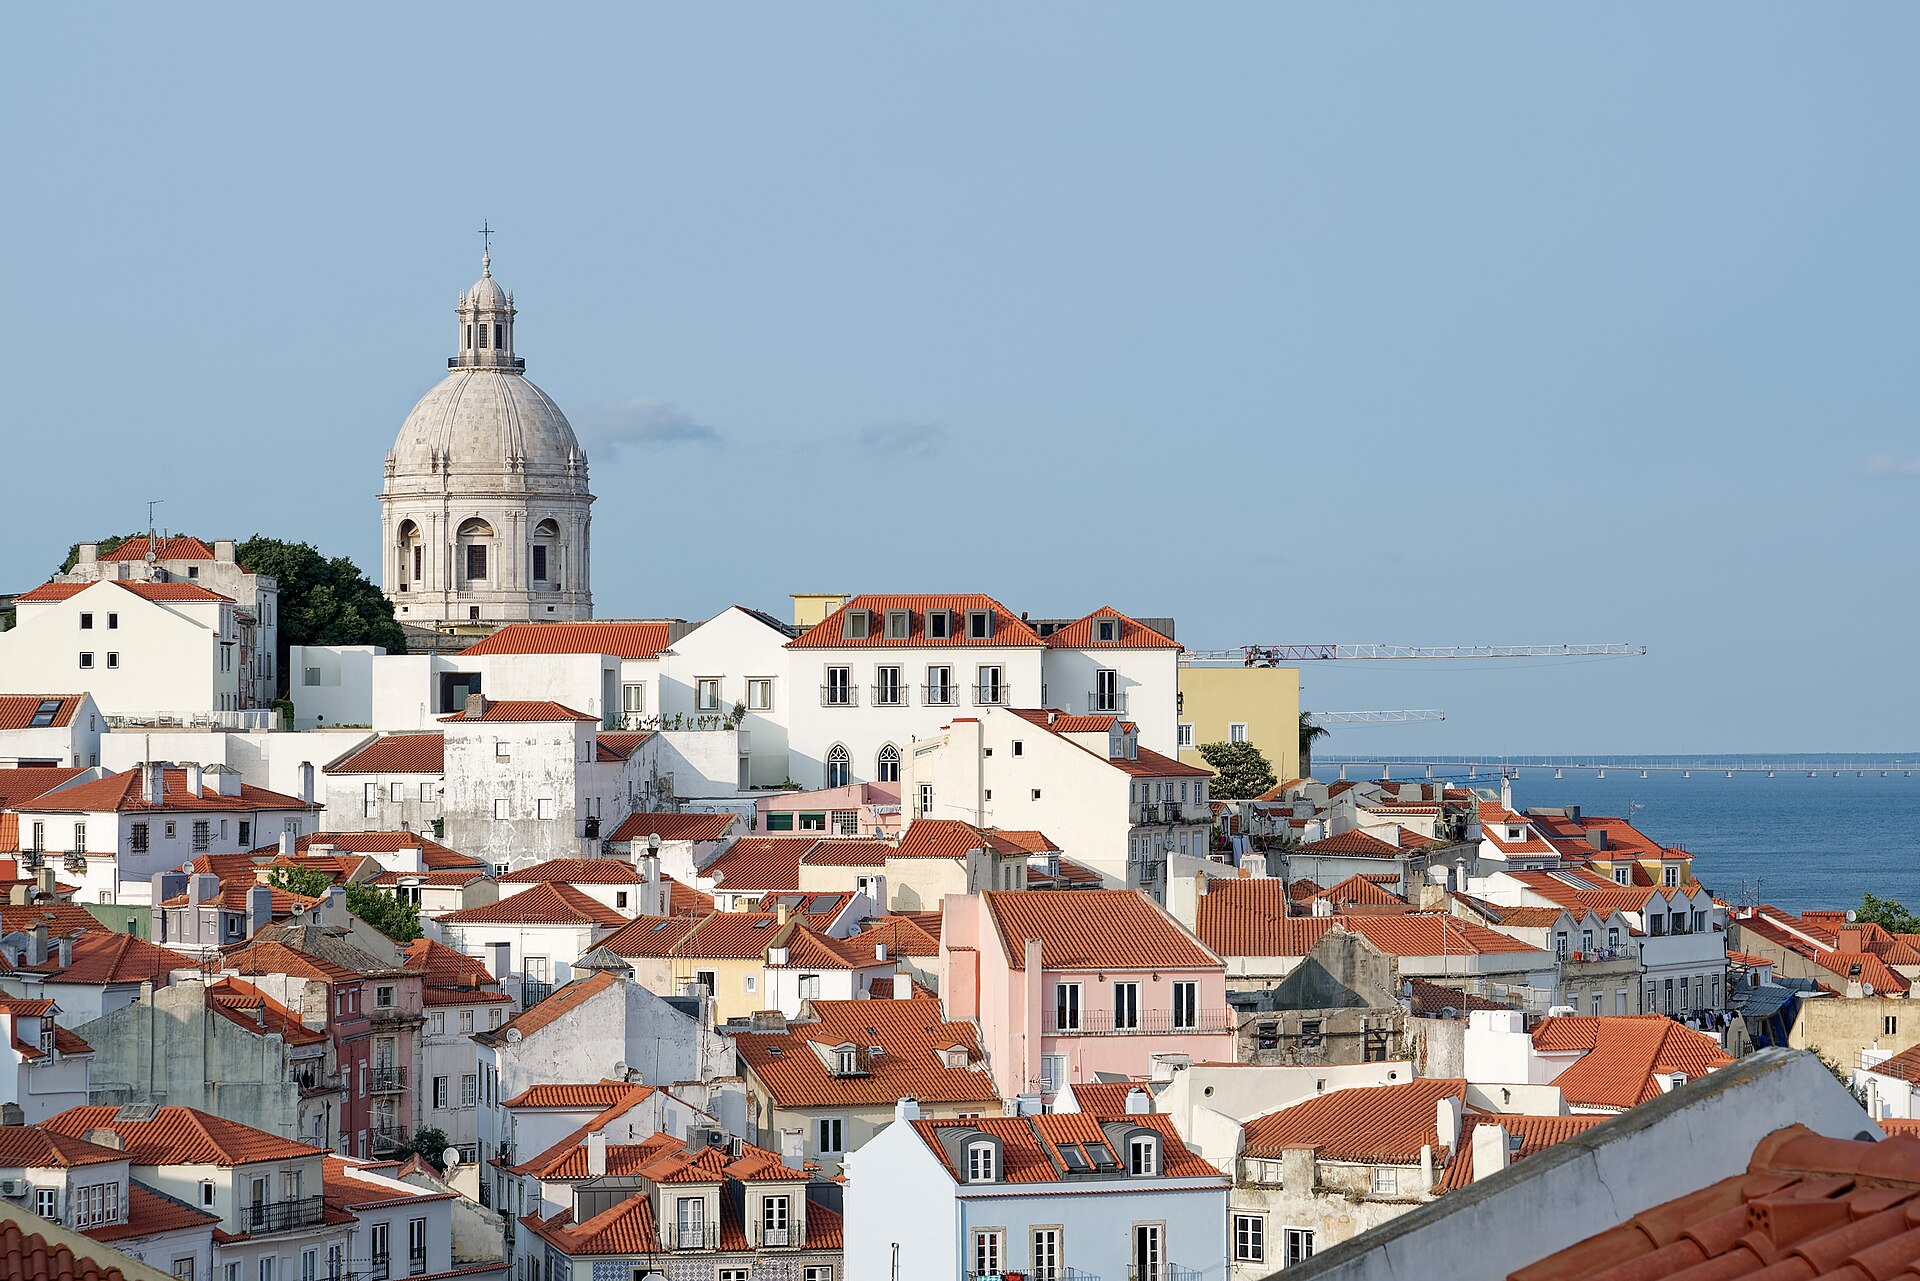
View from Miradouro de Santa Luzia, Lisbon, 20250603 2016 9045
Photo: Jakub Hałun · Wikimedia Commons · CC BY 4.0

In 2011 Portugal could no longer borrow at affordable rates and received a €78 billion rescue package. The years of austerity that followed were painful: wages were cut and many young people emigrated.

$0$10,000$20,000$30,000$40,000$50,000$60,000$70,0002000200420082012201620202025SpainPolandPortugalGreece
$0$10,000$20,000$30,000$40,000$50,000$60,000$70,0002000200820162025SpainPolandPortugalGreece
GDP per person (PPP) · 2000–2025 · Open in the interactive tool →

Steady since 2014

Tourism, exports and foreign investment helped Portugal recover. Government debt has fallen to about 89.7% of GDP, from well above 120% a decade ago.

A new comparison

Adjusted for prices, Portugal now has a GDP per person of $53,145. In 2000 it was 1.8× as rich as Poland; today the two are almost level (102%). For Portugal, the new neighbours in the EU ranking are in the east.

Source: World Bank, World Development Indicators (CC BY 4.0). Latest year: 2025.

More stories

🇬🇷 Greece: 146.6%146.6%🇮🇹 Italy: 137.1%137.1%🇫🇷 France: 115.5%115.5%🇧🇪 Belgium: 107.9%107.9%🇬🇧 United Kingdom: 102.1%102.1%🇪🇸 Spain: 100.5%100.5%🇵🇹 Portugal: 89.7%89.7%🇦🇹 Austria: 81.4%81.4%🇩🇪 Germany: 62.7%62.7%🇵🇱 Poland: 59.7%59.7%🇳🇱 Netherlands: 44.7%44.7%🇸🇪 Sweden: 34.5%34.5%
Who owes the most in Europe?Government debt ranges from under a third of GDP in Sweden to well over 100% in Greece, Italy and France. What the numbers mean.
$0$20,000$40,000$60,000$80,000$100,00019901995200020052010201520202025
$0$20,000$40,000$60,000$80,000$100,0001990200020102025
Britain and Germany: two big economies, two different modelsGermany is built on industry and exports, Britain on services and finance. Per person, adjusted for prices, Germany has pulled ahead since 2008.
$0$5,000$10,000$15,000$20,000$25,000$30,00019901995200020052010201520202025
$0$5,000$10,000$15,000$20,000$25,000$30,0001990200020102025
Vietnam: from one of Asia's poorest to overtaking the PhilippinesIn 1990 a Filipino was about twice as rich as a Vietnamese. Today Vietnam is clearly ahead. Factories and trade did most of the work.
💬 Suggest an improvement

NationVS is a free, ad-free project and we build it with your ideas. What is missing, confusing or would make it more useful?

Anonymous: we store only your text, the page and the language. Please do not include personal data.