Why unemployment rates are so different around the world

South Africa has an unemployment rate above 30%, Japan under 3%. A low rate does not always mean a strong job market.

November 17, 2026 · Numbers update automatically with the latest data
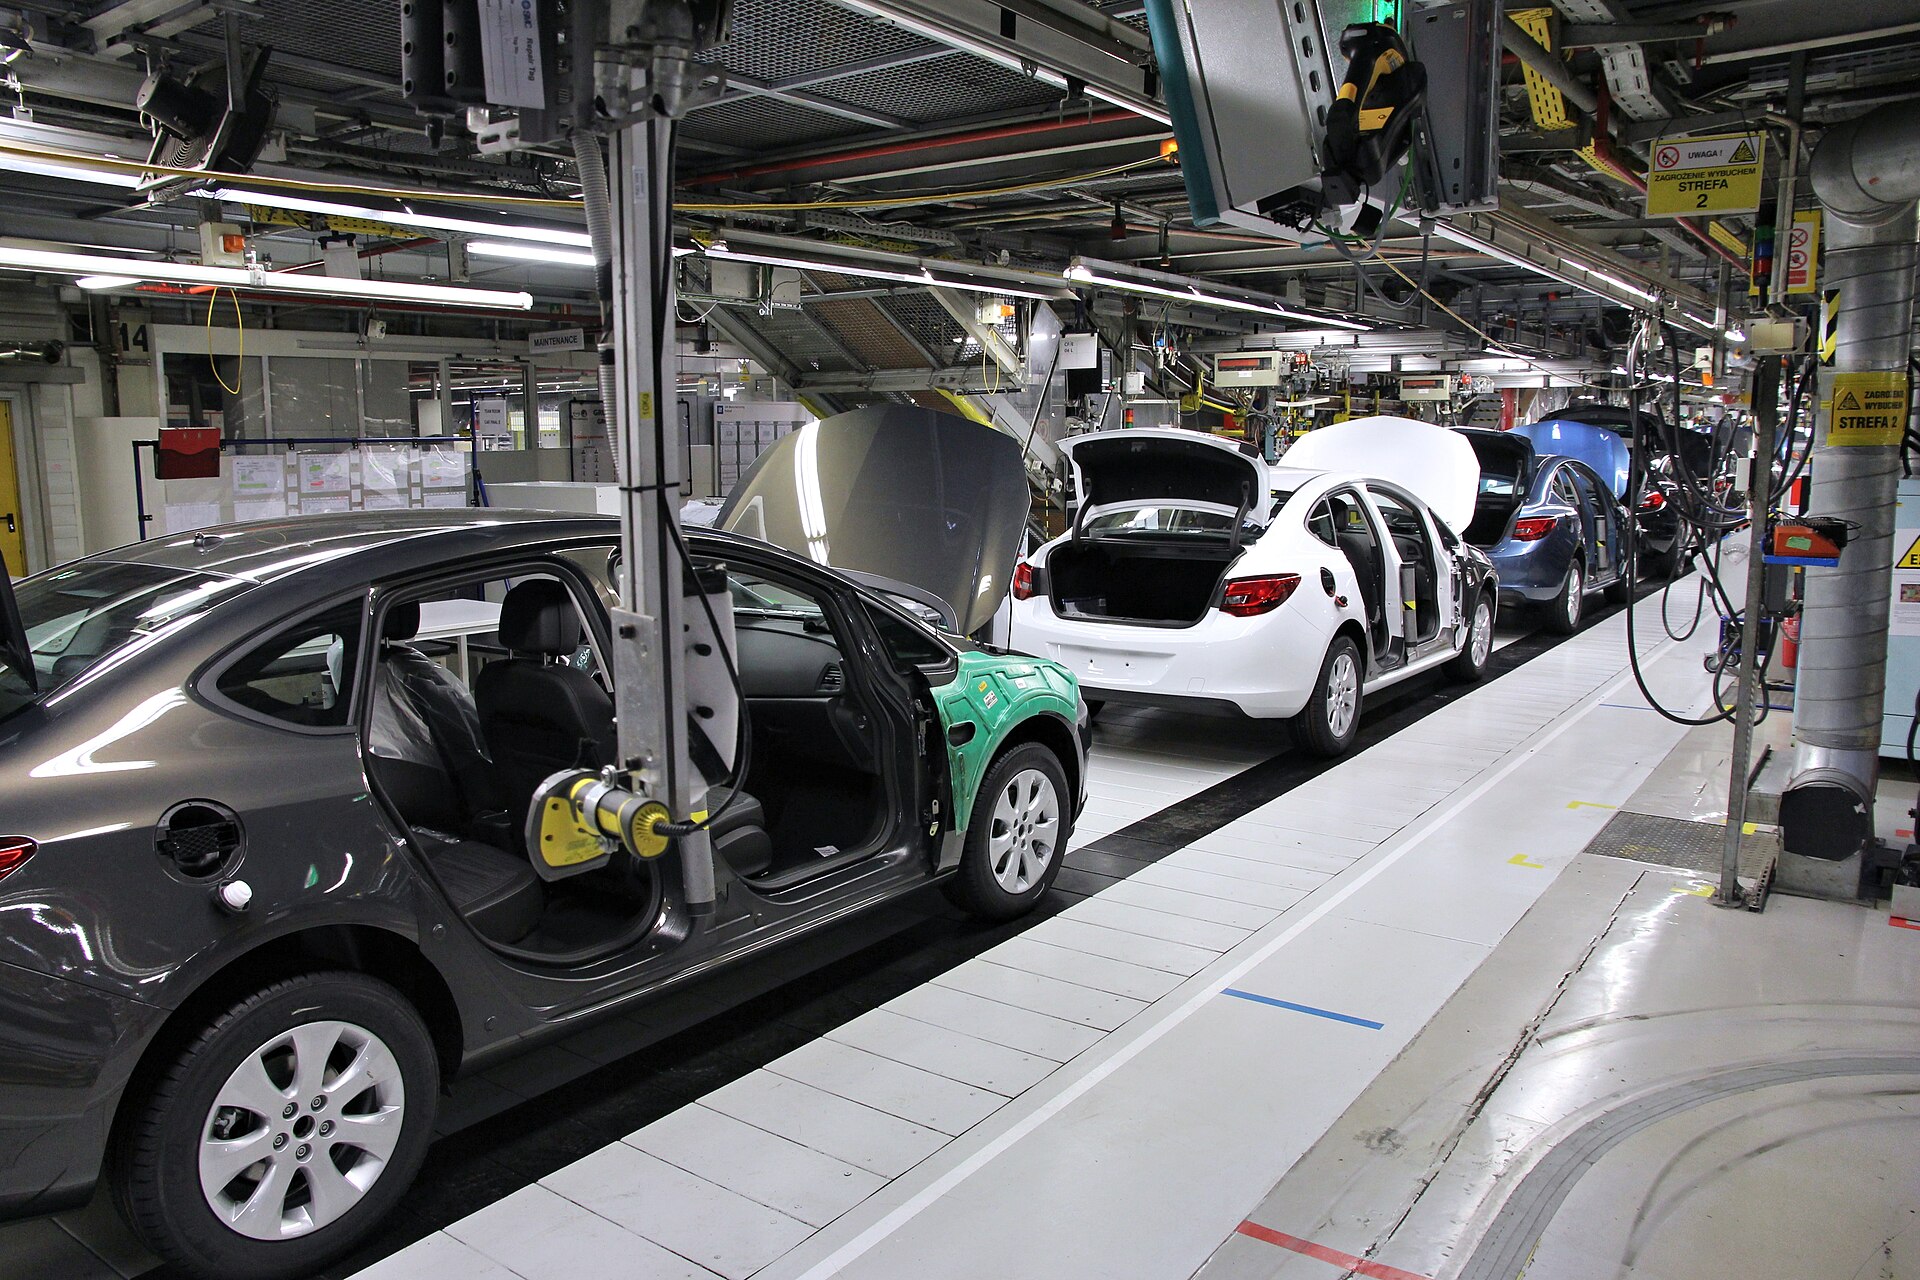
001 Car factory assembly line - Opel factory in Gliwice, Poland
Photo: Marek Ślusarczyk (Tupungato) Photo portfolio · Wikimedia Commons · CC BY 3.0

The unemployment rate counts people who want a job, are looking for one and cannot find it, as a share of everyone working or looking.

🇿🇦 South Africa🇿🇦 South Africa: 32.4%32.4%🇪🇸 Spain🇪🇸 Spain: 10.4%10.4%🇬🇷 Greece🇬🇷 Greece: 8.5%8.5%🇹🇷 Türkiye🇹🇷 Türkiye: 8.5%8.5%🇫🇷 France🇫🇷 France: 7.5%7.5%🇮🇹 Italy🇮🇹 Italy: 6.4%6.4%🇺🇸 United States🇺🇸 United States: 4.2%4.2%🇩🇪 Germany🇩🇪 Germany: 3.7%3.7%🇵🇱 Poland🇵🇱 Poland: 3.0%3.0%🇲🇽 Mexico🇲🇽 Mexico: 2.7%2.7%🇯🇵 Japan🇯🇵 Japan: 2.5%2.5%
Unemployment rate · 2025 · Open in the interactive tool →

The extremes

South Africa has a rate of 32.4%, Spain 10.4%. Japan is at 2.5% and Mexico 2.7%.

Why low is not always good

In poorer countries, many people cannot afford to be unemployed. They take any informal work, such as selling on the street or helping on a farm, and so do not count as unemployed. That is why Mexico, India or Thailand often report lower rates than many European countries.

A better complement

The share of working-age people who have a job (the employment rate) and the share of young people neither working nor studying often tell more than the unemployment rate alone.

Source: World Bank, World Development Indicators (CC BY 4.0). Latest year: 2025.

More stories

$0$20,000$40,000$60,000$80,000$100,000$120,000$140,00019901995200020052010201520202025
$0$20,000$40,000$60,000$80,000$100,000$120,000$140,0001990200020102025
Oil: curse or blessing?Norway turned oil into one of the world's richest societies. Venezuela, Nigeria and Angola did not. What makes the difference?
$0$5,000$10,000$15,000$20,0002000200420082012201620202025
$0$5,000$10,000$15,000$20,0002000200820162025
The countries that went backwardsMost countries are much richer than in 2000. A handful are poorer, usually because of war, state collapse or economic mismanagement.
🇯🇵 Japan: 204.8%204.8%🇸🇬 Singapore: 165.7%165.7%🇬🇷 Greece: 146.6%146.6%🇮🇹 Italy: 137.1%137.1%🇺🇸 United States: 124.4%124.4%🇫🇷 France: 115.5%115.5%🇨🇦 Canada: 113.6%113.6%🇬🇧 United Kingdom: 102.1%102.1%🇨🇳 China: 98.6%98.6%🇩🇪 Germany: 62.7%62.7%🇰🇷 South Korea: 52.4%52.4%🇷🇺 Russia: 16.6%16.6%
Japan owes twice its GDP. Why hasn't it gone bust?Japan's government debt is about two years of output, the highest of any rich country. Yet it pays very low interest. Here is why debt levels can mislead.
💬 Suggest an improvement

NationVS is a free, ad-free project and we build it with your ideas. What is missing, confusing or would make it more useful?

Anonymous: we store only your text, the page and the language. Please do not include personal data.